Software Thermal Design
Modern cooling products rely heavily on predictive thermal simulation before physical prototyping. We conduct comprehensive thermal design and analysis using professional simulation software, avoiding repeated trial production and cutting your R&D costs.
Professional Thermal Simulation Analysis
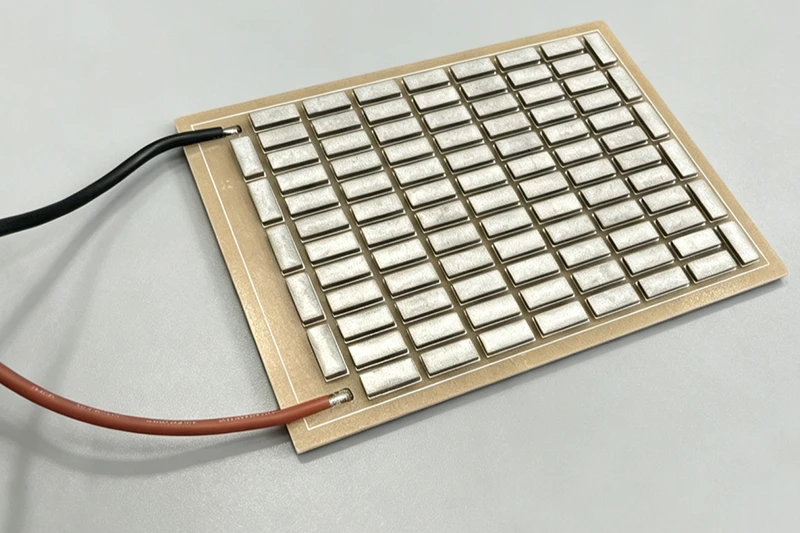
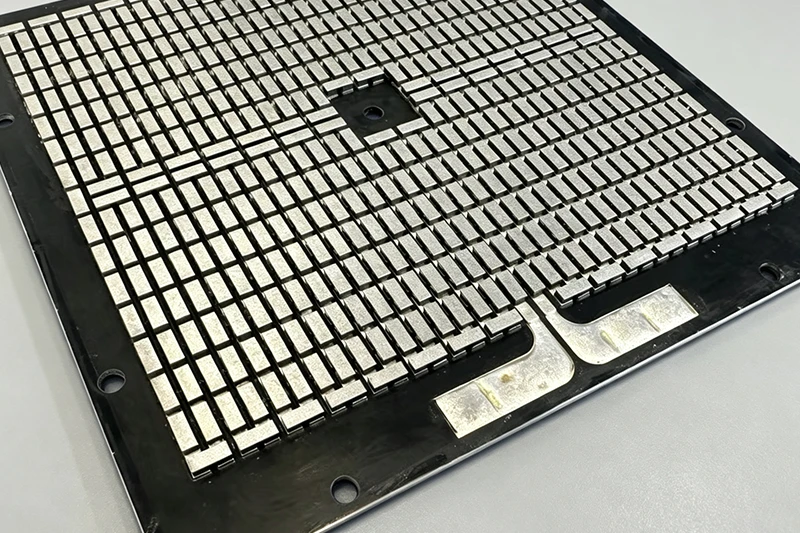
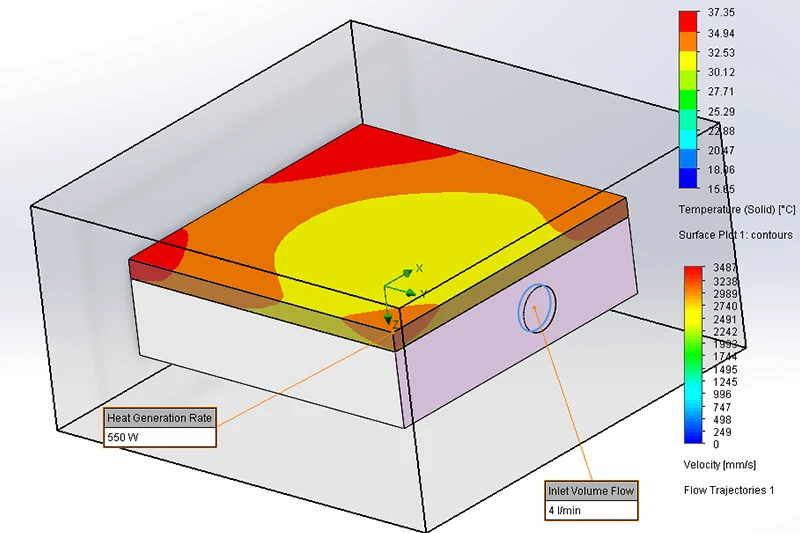
Our engineers are proficient in mainstream thermal simulation platforms including Ansys Icepak . We build accurate digital models according to product structure, power consumption, operating conditions and thermal targets. Our simulation covers heat sink performance, flow distribution of liquid cold plates, temperature field distribution of TEA/TEC modules, airflow field and hot spot analysis.
We carry out iterative optimization of structures and heat transfer schemes in a virtual environment. Potential overheating risks can be identified at the design phase rather than during physical testing. This greatly reduces unnecessary prototype iterations, shortens the R&D cycle and ensures the final cooling assembly meets your real-world temperature control requirements.
TEC / TEA Module Performance Characteristic Curves
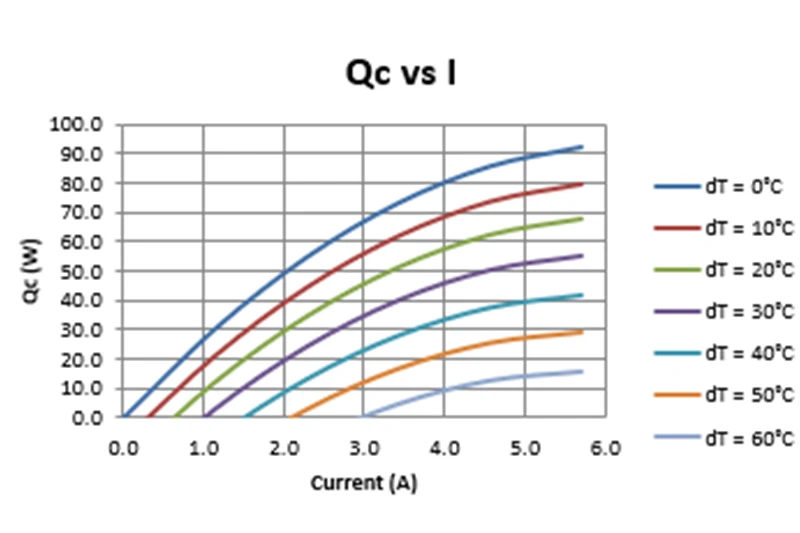
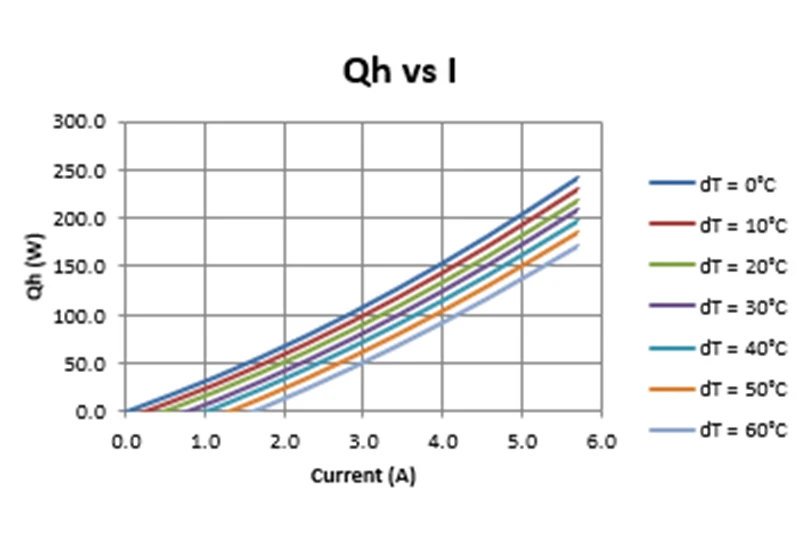
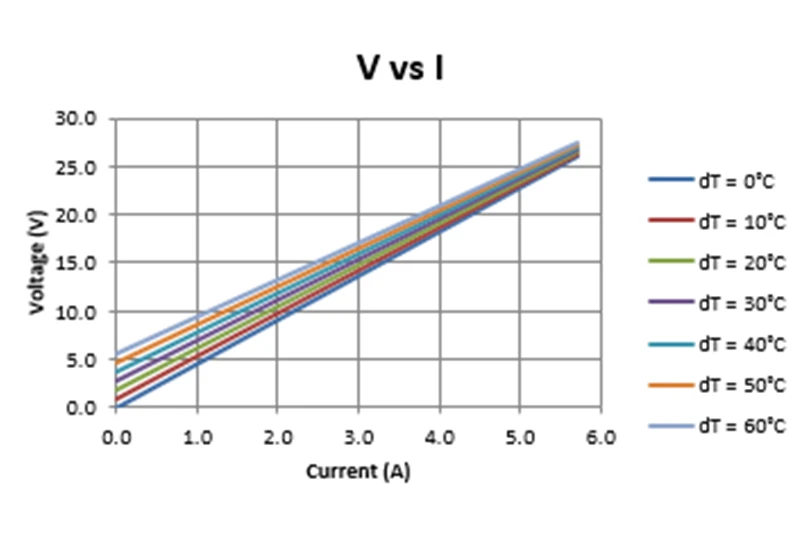
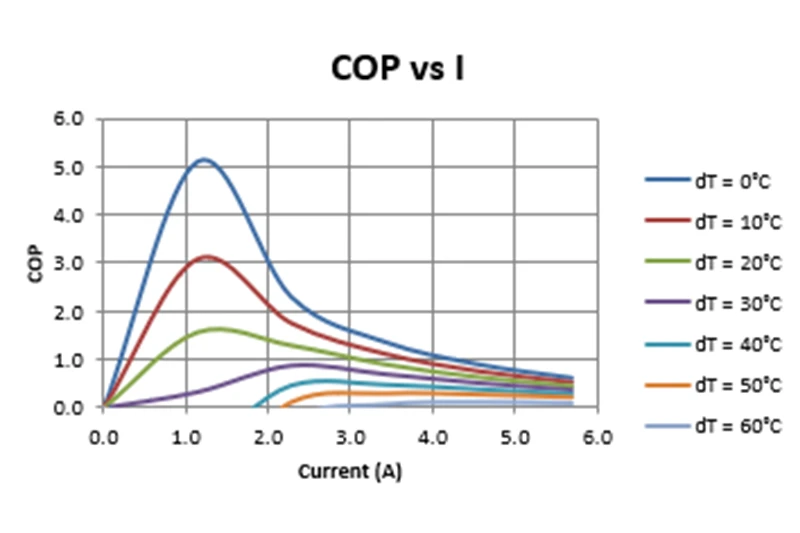
These characteristic curves illustrate cooling capacity, heat rejection, voltage and COP against operating current under different temperature differences (ΔDT). The data guides power supply matching, heat sink design and optimal operating point selection for thermal solutions.
Qc vs I
Qc = Cooling Capacity (W);
I = Operating Current (A)
It shows how cooling capacity varies with input current under different hot-cold side temperature differences ΔDT. The larger ΔDT is, the lower the cooling capacity at the same current.
Qh vs I
Qh = Heat Rejection Capacity (W)
It represents the total heat that must be dissipated from the hot side of the thermoelectric module (cooling load + Joule heat). It serves as the core reference for heat sink design.
V vs I
V = Operating Voltage (V)
The voltage-current characteristic of the module, applied for power supply selection.
COP vs I
COP = Coefficient of Performance
Energy efficiency indicator: higher COP means better cooling output per power consumption. Each curve has an optimal operating current. Efficiency keeps decreasing once current exceeds this point.