In high-speed optical modules with cooling function, TEC thermoelectric coolers are core active devices with frequent start-stop cycles. Temperature difference during cooling generates cyclic shear load, while sustained high temperature at the hot side brings steady-state aging load. These two types of loads couple with each other and reduce the service life of TEC. Starting from a real failure case of a 400G cooled optical module, this article identifies thermoelectric cooling module failure modes, analyzes laminated fatigue mechanisms, derives the composite accelerated life model of Coffin‑Manson and Arrhenius, sorts out common calculation pitfalls in reliability test conversion, and provides a practical evaluation specification for TEC life verification of optical modules.
A 400G cooled optical module suffered cooling performance degradation after 3 years of service at the customer site. Under the same temperature control target of 45°C, the TEC driving current rose from 1.1 A to 1.6 A, and stable temperature control could not be achieved, eventually triggering overheat protection shutdown.
Disassembly confirmed the failure characteristics: through cracks appeared in the top and bottom solder layers of the TEC, and the contact resistance at both ends of the thermopile array increased significantly.
Review of the verification test: the TEC only completed 500 thermal cycles (ΔT=60°C). Based on a simple conversion of 2 start-stop cycles per day, the report marked “equivalent service life over 3 years”. For the data center optical module in this customer scenario, the frequency of 2 start-stop cycles per day for TEC is reasonable. However, the hot side remained steadily above 70°C in actual service, and this steady high-temperature load was not covered in the previous verification test.
The root cause of this failure: only thermal cycling fatigue was evaluated, while the high-temperature accelerated degradation term was omitted. The actual service life of thermoelectric cooling cold plate needs to be calculated with the superposition of both loads.
1. Failure Mode Determination: Locate Composite Failure Paths Based on Field Degradation Characteristics
| Item | Case Description | Implication |
|---|---|---|
| Time of occurrence | Gradual degradation after 3 years in service | Fatigue accumulation, non-catastrophic failure |
| Degradation symptom | Rising TEC current, reduced ΔTmax | Increased contact resistance path |
| Damage location | Through cracks in top / bottom solder layers | Coffin‑Manson dominated region |
| Test gap | Only thermal cycling tested, steady high temperature at hot side not covered | Arrhenius term omitted |
| Root failure mechanism | Solder layer thermal cycling fatigue + high-temperature accelerated degradation | CM × Arrhenius composite failure model |
2. Analysis of Failure Mechanism of TEC Laminated Structure: Solder Layer as the Main Fatigue Damage Zone
The TEC adopts a sandwich stacked structure: dozens of pairs of P/N thermocouples are connected in series and sandwiched between two AlN ceramic layers. When powered on, the hot side dissipates heat outwards and the cold side absorbs heat. The temperature difference between the cold and hot sides causes the upper and lower ceramics to expand and contract at different rates. The resulting shear deformation is fully borne by the intermediate solder layer. Every cooling start-stop cycle applies one shear load to the solder layer.
Cracks preferentially initiate at the edge of the solder layer and expand continuously along the interface. As the crack area increases, the contact resistance gradually rises. On the drive side, the intuitive manifestation is weakened cooling capacity, and the underlying mechanism is solder fatigue embrittlement.
Apart from solder shear fatigue, the second degradation path comes from the thermoelectric material itself: BiTe thermoelectric material undergoes component segregation under long-term high temperature, and the Seebeck coefficient slowly decreases. This degradation process is independent of start-stop cycles and only determined by temperature, following the Arrhenius model.
Structure description: The TEC stack from top to bottom: cold-side AlN ceramic → solder layer (SnAg/AuSn) → BiTe thermopile array + Cu bridge → solder layer → hot-side ceramic and substrate. Cracks mainly initiate at the upper and lower solder interfaces.
Load comparison of this case: Test ΔT=60°C, 500 cycles; field service ΔT=30°C; Coffin‑Manson exponent m=2, cycle magnification factor 4; hot side temperature 70~85°C, Arrhenius activation energy Ea=0.5 eV, acceleration factor 2.03; composite acceleration factor 8.1.
3. Establishment of Composite Accelerated Life Model: Calculation Specification for Coupled Coffin‑Manson Thermal Cycling Term and Arrhenius High-Temperature Term
Two independent degradation mechanisms correspond to two sets of acceleration models. The final acceleration factor AF is the product of the two terms:
3.1 Thermal cycling term
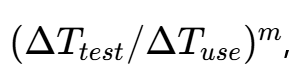
typical value m=2 for solder fatigue
3.2 High-temperature term (Arrhenius):
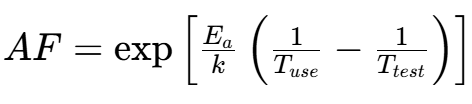
Ea=0.5 eV for BiTe thermoelectric degradation
3.3 Composite acceleration factor: Total AF = thermal cycling term × high-temperature term
The most common incorrect algorithm in the industry: simply divide “500 test cycles” by “2 start-stop cycles per day on site” to get 250 days equivalent life.
Correct calculation sequence: First convert the 60°C test temperature difference to the 30°C field temperature difference via Coffin‑Manson, then convert the 85°C test hot-side temperature to the 70°C field hot-side temperature via Arrhenius, and finally calculate the equivalent life combined with the field start-stop frequency.
4. Practical Demonstration of Life Calculator: Parameter Selection, Acceleration Factor Calculation and Reverse Prediction for Long Service Life
4.1 Parameter Definition and Summary of Common Wrong Parameter Values in Industry
| Parameter | Recommended Value | Common Wrong Value |
|---|---|---|
| ΔT test value | 60°C (thermal cycling amplitude for verification) | Using 整机 temperature change rate instead of cycle amplitude |
| ΔT service value | 30°C (actual temperature difference between cold and hot sides in service) | Taking ambient day-night temperature difference as TEC working temperature difference |
| Exponent m | 2.0 (typical value for solder fatigue) | Misusing aluminum alloy fatigue exponent 2.5 |
| Ea | 0.5 eV (BiTe thermoelectric degradation) | Mixing solder Ea=0.35 eV or chip Ea=0.7 eV |
| Tmax test / service | 85°C / 70°C (hot side temperature) | Incorrectly filling cold-side temperature into Tmax |
4.2 Forward Calculation of Composite Acceleration Factor
| Item | Value | Note |
|---|---|---|
| CM thermal cycling term | 4.00 | (60/30)2 |
| Arrhenius high-temperature term | 2.03 | Ea=0.5, hot side from 70°C to 85°C |
| Composite AF | 8.1x | 4.00 × 2.03 |
Composite AF=8.1: 500 test cycles equal 2000 start-stop cycles in field service. At 2 start-stop cycles per day, the equivalent life is about 2.7 years.The verification report marked “equivalent life over 3 years”, which is right at the critical boundary. The failure occurred in the 3rd year of customer service, consistent with the model prediction.
4.3 Reverse Derivation of Test Verification Conditions Based on 20-Year Life Target
| Index | Value | Interpretation |
|---|---|---|
| Target | How many test cycles are required for 20-year service life | Reverse derivation of verification test conditions |
| Calculation logic | Total field cycles ÷ composite AF | Composite AF as conversion factor |
| Calculation result | 14600 field cycles ÷ 8.1 = 3650 test cycles | 3650 thermal cycles required for 20-year life instead of 500 |
Summary for practical application: thermoelectric cooling heat sink .TEC service life is the product of two degradation models. If only thermal cycling fatigue is calculated, the life estimation will be optimistically amplified by nearly 2 times. 20-year long-term reliability requires 3650 thermal cycle verifications instead of 500.
5. Cross Comparison of Similar Reliability Failure Mechanisms: Applicable Boundary Distinction of Different Failure Models
| Article No. | Failure Mode | Load Type | Model | New Point in This Article |
|---|---|---|---|---|
| Article 15 | Solder joint cracking | Thermal cycling shear | CM (m=2~2.5) | Same solder fatigue mechanism |
| Article 21 | Relay fatigue | Mechanical cycling | S-N curve | Same cyclic load mechanism |
| Article 25 | TEC degradation | Thermal cycling + steady high temperature | CM × Arrhenius | Calculation method for composite acceleration |
| Article 6 | Wire bond degradation | Current + high temperature | Black + NL | Reference for steady-state load |
What can ZICOthermal can help for your thermal project?
Every start-stop of TEC forms a miniature thermal cycle: the solder layer bears shear fatigue, and the thermoelectric material simultaneously suffers steady-state high-temperature aging. Coffin‑Manson thermal cycling term × Arrhenius high-temperature term gives the real acceleration factor. Single thermal cycling verification will underestimate long-term aging risk and bring hidden reliability troubles to optical modules in field service. When engineers perform TEC reliability verification and life assessment, the two types of loads must be calculated in coupling to avoid underestimating failure risks.